Commport Business Analytics allows you to leverage visual supply chain and organizational spend data, giving decision makers powerful intelligence to make better strategic decisions.
Businesses using analytics for growth identification can achieve up to 40% higher ROI.
Businesses struggle to maintain high operational standards without a robust business analytics solution. Without effective tools to manage and analyze data, organizations face several critical challenges:
The inability to integrate data from production, and supply chain systems hampers a unified view of operations.
Poor data accuracy and the lack of real-time information lead to flawed analysis and delayed decision-making.
Tracking quality issues becomes inefficient, impacting performance evaluation and process improvement efforts.
Tracking quality issues becomes inefficient, impacting performance evaluation and improvement efforts.
Businesses struggle to process and analyze increasing amounts of data, leading to operational bottlenecks.
Limited real-time data restricts the ability to identify and resolve issues, resulting in lost productivity and revenue.
Unlock actionable insights and drive smarter decisions with Commport Business Analytics. Our solution integrates seamlessly with your systems, ensures real-time data accuracy, and provides powerful reporting and visualization tools to help your business stay ahead.
Experience the power of instantaneous insights with our cutting-edge supply chain analytics. Unlike traditional methods that require time-consuming compilation, our system delivers real-time, comprehensive data for instant measurement of supply chain performance and savings.
Generating rich reports or viewing graphical data doesn’t have to be complicated!
Unlock the true potential of your supply chain by prioritizing relationships and visibility with your key vendors. Our platform empowers you to eliminate costly errors by monitoring organizational spend efficiently. With a clear understanding of your operational breadth, you can negotiate effectively and cultivate stronger bonds with your vendor community, extracting maximum value from every relationship
Budget owners, finance leaders and procurement managers have access to the rich analytics and data they need, in an intuitive custom dashboard. With a few clicks, information on organizational spend, transactions, errors, order exceptions and vendor KPI scorecard metrics are all presented graphically for easy monitoring, reporting and strategic decision making.
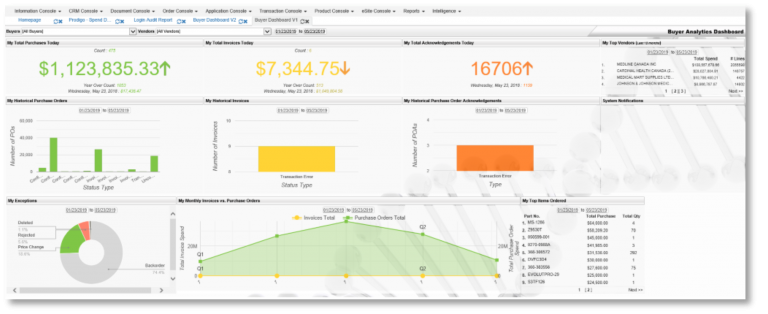
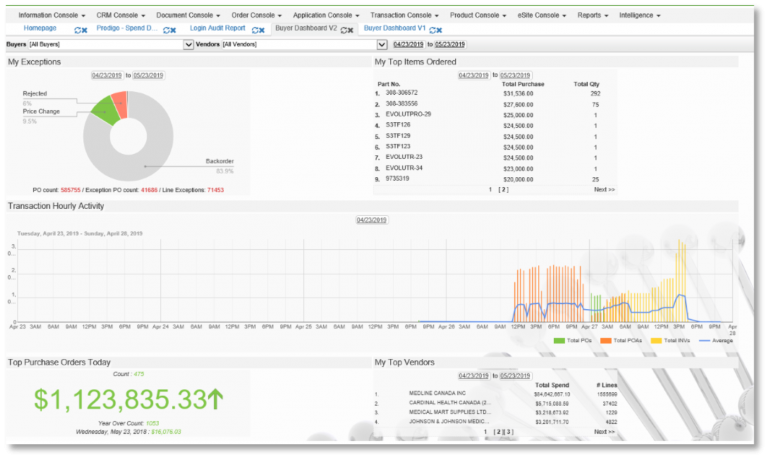
Purchase Orders that contain an error, result in costly reconciliation costs, as studies show it can cost as much as $60 plus to manually reconcile a Purchase Order with an error. Using visibility into order and order vendor response will result in immediate ROI benefits by reducing reconciliation time and price inaccuracies.
In one view you see the dollar value gained from increased efficiency, control, vendor collaboration, reduced errors and eliminated manual paper based workflows.
Visibility into spend metrics across the supply chain allowing you to track the total value of organizational purchasing. See how much your organization has spent this week, by either individual location or vendor; or report spend by product and product type or classification. Find out spend by buyer, vendor, ship to location, business unit or product category to eliminate maverick off contract spend and reign in cost efficiencies.
Provides critical order information to ensure smooth and effective supply chain operations. All transactions are tracked and can be viewed by time frame, vendor, transaction type or by each individual electronic document. Built in is an order exceptions dashboard that highlights problem transactions to be reconciled, saving expensive manual labor costs. Orders which contain price discrepancies between PO, POA and Invoice trigger a notification to be verified to ensure bad data is not continually passed along.
Displays all your product rebate savings from your entire vendor community. Through this view find savings from your top vendors to build better value relationships and savings. Search by vendor, category or classification.
Get insight into the effect of changing product prices based on your organizational purchasing behavior. Understanding the effect of a price increase or re-negotiated contract, allows decision makers to better understand the effect on supply chain costs.
Find 2-way price discrepancies between the Purchase Order and Price Order Acknowledgement or 3-way between PO,POA and Invoice to ensure price accuracy across the purchase life cycle. View price exceptions by vendor to find areas for improvement.
Reduce the number of unique EDI maps to the minimumal data to internal systems, creating a repeatable process
Gain visibility into entire organizational spend in one view with search and filters into historical timeframes. Reporting and Analysis is easy with quick reporting.
Quickly track all your savings rebates from your vendor community. Track your top vendors to build stronger relationships to deliver more value to your supply chain.
Commport Business Analytics provides powerful insights into your EDI and supply chain data, enabling data-driven decision-making for improved business performance. Our analytics platform consolidates data from multiple sources, giving you a comprehensive view of your transactions, partner interactions, and operational efficiencies. With customizable dashboards, detailed reporting, and real-time data visualization, you can easily identify trends, track key performance metrics, and uncover areas for cost savings. Commport Business Analytics empowers you to proactively address issues, optimize workflows, and make strategic decisions that enhance productivity. Whether you're monitoring compliance, measuring partner performance, or analyzing transaction volumes, Commport Business Analytics turns data into actionable intelligence that drives business success.
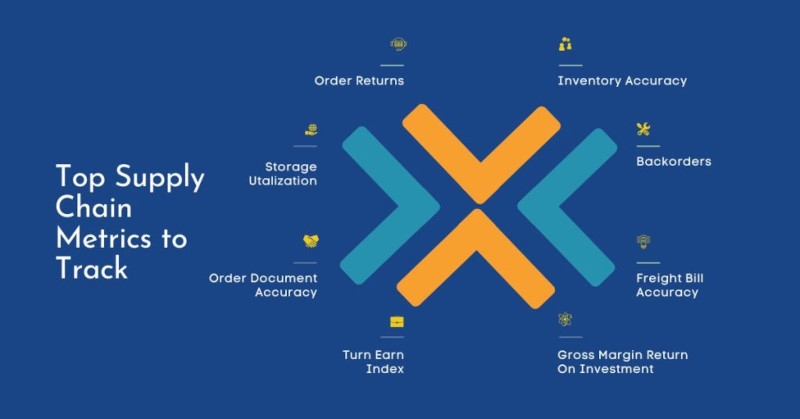
Commport business analytics solutions can help you track these metrics continuously with real-time data insights and dashboards.
Download NowDiscover the transformative impact of our EDI, CPS, and VAN solutions through the powerful testimonials of satisfied clients who have experienced remarkable results with Commport products and services.



Supply chain analytics is the analysis of information companies draw from a number of applications tied to their supply chain which includes inventory management system, order management system, warehouse management system and many more!
Business Analytics is the process by which businesses use statistical methods and technologies for analyzing historical data in order to gain new insight and improve strategic decision-making.
A Supply Chain Dashboard is a reporting tool used to track supply chain KPIs and metrics in a single display or interface. Supply chain dashboards track inventory levels, logistics management, and warehouse operations.
Optimize supply chain management with Bold BI to run your business without interruptions
They also provide mechanisms to track the progress of various supply chain initiatives against identified metrics
By analyzing customer data, supply chain analytics can help a business better predict future demand.
Commport Business Analytics allows you to leverage visual supply chain and organizational spend data, giving decision makers powerful intelligence to make better strategic decisions.
Visualize Your Metrics
Budget owners, finance leaders and procurement managers have access to the rich analytics and data they need, in an intuitive custom dashboard. With a few clicks, information on organizational spend, transactions, errors, order exceptions and vendor KPI scorecard metrics are all presented graphically for easy monitoring, reporting and strategic decision making.
See Savings
Purchase Orders that contain an error, result in costly reconciliation costs, as studies show it can cost as much as $60 plus to manually reconcile a Purchase Order with an error. Using visibility into order and order vendor response will result in immediate ROI benefits by reducing reconciliation time and price inaccuracies.
In one view you see the dollar value gained from increased efficiency, control, vendor collaboration, reduced errors and eliminated manual paper based workflows.